Tick season in Fairfield County, CT: tick and mosquito data by town
The worst months for ticks are May, June and July, when blacklegged (deer) tick nymphs peak, and CAES advises spraying once in May or early June. Adults peak in March and April, then again in October and November. The table covers all 23 towns: 2025 tick testing, 2026 West Nile results and housing age, with sources and a free CSV.
Found a tick or a nest right now?
- Tick bite: save the tick. Save it dry in a sealed bag; send it to CAES for free testing through your health department or by mail. See a doctor if a rash or fever follows.
- Nest by the door: keep back. Keep people and pets away from the nest; trouble breathing or hives all over need medical care right away.
- Droppings: air the room, then wet-clean. Air the room for 30 minutes, wear gloves and soak droppings with disinfectant or bleach before wiping; never sweep or vacuum them.
- Suspected bed bugs: report it. Renters tell the landlord, who has five business days to inspect; homeowners ask a DEEP-registered pest control company to inspect.
The town table is built from the CAES tick and mosquito reports and the Census year-built table, and the 10 towns with their own guide pages are linked. Read the methodology before comparing towns: a tick count measures how many ticks people sent in, not how many ticks live in a town.
Pest calendar
| Pest | Peak months | January | February | March | April | May | June | July | August | September | October (this month) | November | December |
|---|---|---|---|---|---|---|---|---|---|---|---|---|---|
| Blacklegged tick nymphs, 1 | May–Jul | none reported | none reported | none reported | none reported | peak | peak | peak | active | active | none reported | none reported | none reported |
| Blacklegged tick adults, 1 | Mar–Apr, Oct–Nov | active | active | peak | peak | active | none reported | none reported | none reported | none reported | peak | peak | active |
| Mosquitoes (West Nile virus risk), 2 | Jul–Sep | none reported | none reported | none reported | none reported | none reported | active | peak | peak | peak | active | none reported | none reported |
- Peak: the busiest months
- Active
- None reported
- October (this month)
How to get a tick tested
The CAES submission page says “There is no cost for tick identification or testing,” though towns or health departments “may charge a small fee for handling and mailing.” Send the tick dry, in a crush-proof container or sealed bag, through your health department, by mail, or to the lab at 123 Huntington Street, New Haven. Local routes differ by town; the FAQ on tick testing lists them, including Fairfield’s $5 fee. Trumbull’s Health Department also charges $5 and keeps a locked drop box by its front entrance, checked daily, with results emailed within two weeks, by its tick page; see tick testing in Trumbull. In Shelton the Naugatuck Valley Health District forwards ticks for $5 each, or you can mail one to CAES yourself; see Shelton’s tick route. A result tells you what the tick carried, not whether you are infected, so talk to your doctor about the bite.
How do the county’s 23 towns compare?
| Town | Ticks submitted to CAES, 2025 | Ticks tested, 2025 | Lyme-positive share, 2025 | Babesia-positive share, 2025 | Small sample, 2025 | Ticks tested, 2024 | Lyme-positive share, 2024 | Babesia-positive share, 2024 | WNV-positive mosquito samples, 2026 | CAES mosquito trap | Median year built | Note | Sources |
|---|---|---|---|---|---|---|---|---|---|---|---|---|---|
| Bethel | 68 | 57 | 35% (20 of 57) | 14% (8 of 57) | No | 29 | 34% (10 of 29) | 10% (3 of 29) | 5, at one trap (Meckauer Park) | Yes | 1974 | - | 1–4 |
| Bridgeport | 14 | 8 | 38% (3 of 8) | 25% (2 of 8) | Yes | 5 | 40% (2 of 5) | 0% (0 of 5) | 11, across 3 traps | Yes | 1955 | Only 8 ticks tested, so the shares are unstable | 1–4 |
| Brookfield | 84 | 63 | 43% (27 of 63) | 17% (11 of 63) | No | 42 | 29% (12 of 42) | 14% (6 of 42) | None reported: no CAES trap | No | 1978 | No CAES mosquito trap in the town | 1–5 |
| Danbury | 79 | 53 | 36% (19 of 53) | 28% (15 of 53) | No | 43 | 33% (14 of 43) | 12% (5 of 43) | 3, at one trap (Reservoir Road) | Yes | 1975 | Highest Babesia share of the 23 towns | 1–4 |
| Darien | 109 | 37 | 22% (8 of 37) | 16% (6 of 37) | Yes | 28 | 29% (8 of 28) | 21% (6 of 28) | 7, across 2 traps | Yes | 1956 | Only 37 of 109 ticks were testable | 1–4 |
| Easton | 35 | 26 | 54% (14 of 26) | 23% (6 of 26) | Yes | 22 | 18% (4 of 22) | 5% (1 of 22) | 0 (one trap, negative) | Yes | 1974 | Only 26 ticks tested | 1–4 |
| Fairfield | 118 | 83 | 36% (30 of 83) | 10% (8 of 83) | No | 77 | 25% (19 of 77) | 12% (9 of 77) | 5, across 2 traps | Yes | 1960 | Health department forwards ticks to CAES for $5 | 1–4, 6 |
| Greenwich | 6 | 4 | 25% (1 of 4) | 25% (1 of 4) | Yes | 4 | 25% (1 of 4) | 25% (1 of 4) | 14 (12 at the Civic Center) | Yes | 1963 | Most ticks go to the town lab ($76); this counts CAES submissions only | 1–4, 7 |
| Monroe | 85 | 62 | 42% (26 of 62) | 16% (10 of 62) | No | 65 | 38% (25 of 65) | 14% (9 of 65) | 0 (one trap, negative) | Yes | 1978 | - | 1–4 |
| New Canaan | 159 | 104 | 33% (34 of 104) | 12% (12 of 104) | No | 78 | 29% (23 of 78) | 8% (6 of 78) | 3, all at Hoyts Swamp | Yes | 1967 | Michigan Road trap negative in 2026 | 1–4 |
| New Fairfield | 31 | 20 | 30% (6 of 20) | 10% (2 of 20) | Yes | 20 | 20% (4 of 20) | 30% (6 of 20) | None reported: no CAES trap | No | 1969 | Only 20 ticks tested; no CAES mosquito trap | 1–5 |
| Newtown | 187 | 146 | 47% (68 of 146) | 20% (29 of 146) | No | 159 | 31% (50 of 159) | 10% (16 of 159) | 1, at one trap (Key Rock Road) | Yes | 1977 | Includes ticks from its Newtown-based health district | 1–4 |
| Norwalk | 175 | 93 | 31% (29 of 93) | 11% (10 of 93) | No | 87 | 15% (13 of 87) | 9% (8 of 87) | 3, all at Rowayton School | Yes | 1967 | Cranbury Park trap negative in 2026 | 1–4 |
| Redding | 187 | 153 | 43% (66 of 153) | 22% (34 of 153) | No | 117 | 23% (27 of 117) | 11% (13 of 117) | 1, at one trap (Lyons Swamp) | Yes | 1972 | - | 1–4 |
| Ridgefield | 217 | 148 | 43% (64 of 148) | 18% (27 of 148) | No | 106 | 36% (38 of 106) | 12% (13 of 106) | 0 (one trap, negative) | Yes | 1972 | - | 1–4 |
| Shelton | 40 | 31 | 23% (7 of 31) | 3% (1 of 31) | Yes | 18 | 39% (7 of 18) | 6% (1 of 18) | 3, at one trap (Shelton Avenue) | Yes | 1977 | Mailed by residents only: district ticks count under Seymour | 1–4 |
| Sherman | 14 | 9 | 67% (6 of 9) | 0% (0 of 9) | Yes | 8 | 38% (3 of 8) | 0% (0 of 8) | None reported: no CAES trap | No | 1975 | Only 9 ticks tested; no CAES mosquito trap | 1–5 |
| Stamford | 211 | 188 | 32% (60 of 188) | 14% (27 of 188) | No | 117 | 14% (16 of 117) | 9% (11 of 117) | 14, across 3 traps | Yes | 1973 | Most ticks tested of the 23 towns | 1–4 |
| Stratford | 73 | 37 | 35% (13 of 37) | 24% (9 of 37) | Yes | 24 | 17% (4 of 24) | 4% (1 of 24) | 14 (12 at Beacon Point) | Yes | 1958 | Only 37 of 73 ticks were testable | 1–4 |
| Trumbull | 161 | 113 | 35% (40 of 113) | 10% (11 of 113) | No | 95 | 21% (20 of 95) | 8% (8 of 95) | 2, at one trap (Cranbury Drive) | Yes | 1965 | - | 1–4 |
| Weston | 18 | 14 | 57% (8 of 14) | 7% (1 of 14) | Yes | 8 | 38% (3 of 8) | 0% (0 of 8) | 1, at one trap (Devil’s Den) | Yes | 1967 | Mailed by residents only: district ticks count under Westport | 1–4 |
| Westport | 277 | 166 | 33% (55 of 166) | 11% (19 of 166) | No | 164 | 24% (40 of 164) | 10% (16 of 164) | 6, across 2 traps | Yes | 1967 | Includes ticks from its health district, which also serves Weston | 1–4 |
| Wilton | 207 | 144 | 36% (52 of 144) | 12% (17 of 144) | No | 138 | 33% (45 of 138) | 14% (19 of 138) | 0 (two traps, both negative) | Yes | 1970 | - | 1–4 |
Numbers in the Sources column refer to:
Rows are in alphabetical order, as in the CSV. Each share is CAES’s rounded percentage of the town’s tested ticks, with the count behind it in brackets. “Small sample” marks the towns where CAES tested fewer than 50 ticks in 2025.
What’s the worst month for ticks?
For the blacklegged (deer) tick, the one that carries the Lyme disease bacterium, the riskiest stretch is May, June and July. The CAES Tick Management Handbook says “May, June and July are peak months for nymphal tick activity.” Nymphs are tiny, so their bites are the easiest to miss.
The handbook’s seasonal guide runs through the whole year:
- Early spring (March and April): adult ticks, a “second peak of activity”.
- Late spring (May): nymphs appear in mid-May.
- Early summer (June and July): the nymphal “peak period”.
- Late summer (August and September): larvae peak; a few nymphs may still be around.
- Fall (October and November): adults are active.
- Winter (December to February): adults are active in warm weather, because “the ticks do not hibernate”.
Adults matter too. In an April 6, 2026 press release, CAES said adult blacklegged ticks “often have higher infection rates because they have had two chances to acquire disease agents” as larvae and nymphs.
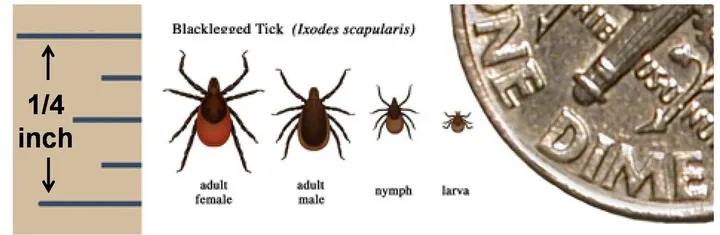
Types of ticks in Connecticut: deer tick, lone star, dog and longhorned ticks
Four kinds of tick turn up in Connecticut homes and yards, and one of them does most of the harm. In 2025 CAES identified 5,896 ticks sent in by residents, health departments and healthcare providers. Blacklegged (deer) ticks were 4,094 of them (69.4%), American dog ticks 1,486 (25.2%), lone star ticks 266 (4.5%) and Asian longhorned ticks 46 (0.8%), according to the CAES 2025 summary. CAES tests only blacklegged ticks that fed on a person, so every Lyme and Babesia figure on this page is about deer ticks.
| Tick | Share of CAES submissions, 2025 | What CDC links it to |
|---|---|---|
| Blacklegged (deer) tick | 69.4% | Lyme disease, anaplasmosis, babesiosis, hard tick relapsing fever, ehrlichiosis, Powassan virus |
| American dog tick | 25.2% | Rocky Mountain spotted fever, tularemia |
| Lone star tick | 4.5% | Ehrlichiosis, Heartland and Bourbon viruses, tularemia, STARI rash; may trigger alpha-gal syndrome |
| Asian longhorned tick | 0.8% | No spread to people confirmed in the US |
Sources: CAES 2025 summary and CDC, Where Ticks Live.
Blacklegged (deer) tick
The deer tick is the blacklegged tick, Ixodes scapularis. CDC’s Lyme disease causes page calls it “the blacklegged tick (or deer tick, Ixodes scapularis)” and names it as the tick that spreads Lyme disease in the Northeast. It also carries the parasite behind babesiosis and the Powassan virus. CDC says nymphs and adult females are the stages most likely to bite people. The nymphs peak from May to July, as the section above shows.
Lone star tick
The adult female “is distinguished by a white dot or ‘lone star’ on her back,” CDC says. It does not spread Lyme disease. Its bite is linked to ehrlichiosis and a rash called STARI, and CDC says “growing evidence suggests” it may trigger alpha-gal syndrome, a red meat allergy. In 2017 CAES and DEEP found the state’s “first known established reproducing population” on Manresa Island in South Norwalk, according to their joint press release. That release said most lone star submissions came “from lower Fairfield County.”
American dog tick
The American dog tick is the second most common tick sent to CAES. It cannot transmit the Lyme bacterium either, per CDC. CDC links it to Rocky Mountain spotted fever and tularemia, and says adult females are the stage most likely to bite people. In Connecticut, adults become active from mid-April to early May and peak in June, according to the CAES Tick Management Handbook.
Asian longhorned tick
CAES reported the state’s first established population of the Asian longhorned tick in Fairfield County in September 2020. Its press release, posted by the Town of Newtown, says a female “can produce offspring—1,000 to 2,000 eggs at a time—without mating.” CDC says it “appears to be less attracted to humans” than native ticks. No spread of disease to people by this tick has been confirmed in the US. In April 2026, CAES said lone star, Gulf Coast and longhorned ticks are established “primarily in the coastal areas of Fairfield and New Haven counties” (CAES press release).
Can ticks live in your house?
Most ticks cannot live indoors for long, but they can be carried in. A University of Florida extension fact sheet on the brown dog tick says that species “is unusual among ticks, in that it can complete its entire life cycle indoors.” It adds that “Many tick species can be carried indoors on animals, but cannot complete their entire life cycle inside.” Other ticks still ride in. CDC’s tick bite prevention page says “Ticks can ride into the home on clothing and pets, then attach to a person later.” Its advice is to tumble dry clothes “on high heat for 10 minutes” after coming in, check pets and bags, and do a full body check.
What does a tick bite infection look like?
A small red bump right after a bite is common, and CDC’s Lyme disease signs page says it “is not a sign of Lyme disease.” The Lyme rash, erythema migrans, is different. It starts at the bite “after a delay of 3 to 30 days (average is about 7 days)” and grows to 12 inches or more, sometimes clearing in the middle into a bull’s-eye. CDC says it shows up in about 70 to 80 percent of infected people. Fever, chills, headache, tiredness and aches can come without it. Only a doctor can diagnose it. CDC’s after a tick bite page says: “If you develop a rash or fever within several days to weeks after removing a tick, see your doctor.”
When should you spray for ticks?
The CAES Tick Management Handbook advises spraying once in May or early June for nymphs; the tick control guide has the full schedule and Connecticut’s rules for spraying (CGS chapter 441).
Is 2026 a bad tick year?
It started busy. CAES said on April 6, 2026 that “During the past few weeks, we have received an average of 30 tick submissions per day for testing, and greater than 40% have tested positive for Lyme disease spirochetes.” That release does not call 2026 a record year, so neither does this guide.
For a yearly comparison, submissions rose statewide: CAES received 4,233 ticks in 2024, according to its 2024 summary, and 5,896 in 2025, according to its 2025 summary. Of the 3,975 blacklegged ticks tested in 2025, 36.9% carried the Lyme bacterium. More submissions can mean more ticks, more bites or simply more people sending ticks in; the summaries don’t say which.
What does the table show?
Which towns sent CAES the most ticks?
Westport sent the most ticks of any town in the county, 277 in 2025, a figure that includes ticks forwarded by the health district based there. Ridgefield sent 217, Stamford 211 and Wilton 207, according to the CAES 2025 summary.
In words: after the top four come Newtown and Redding with 187 each, Norwalk 175, Trumbull, with 161 sent through its town Health Department and by residents, and New Canaan 159. At the bottom are Weston with 18, Bridgeport and Sherman with 14 each, and Greenwich with 6. Stamford had the most ticks tested, 188 of its 211.
Some low numbers need context. Greenwich shows only 6 submissions because the town tests ticks at its own laboratory; its fee schedule lists tick testing at $76. CAES lists Weston under the health district based in Westport and Shelton under the Naugatuck Valley district based in Seymour, so their rows count only ticks residents sent in themselves; ticks the districts forwarded are in the Westport and Seymour totals. Bridgeport shows 14, and only 8 were tested, too few to compare its shares with other towns.
Which Fairfield County town has the highest Babesia rate in ticks?
Danbury. In the CAES 2025 summary, 28% of Danbury’s tested ticks (15 of 53) carried Babesia microti, the parasite that causes babesiosis. That is the highest share among the 14 towns where CAES tested at least 50 ticks. Redding came next at 22% (34 of 153), then Newtown at 20% (29 of 146). Statewide the figure was 14.8%, according to the CAES 2025 summary.
Small samples sit outside that ranking. Bridgeport and Greenwich showed 25%, but on only 8 and 4 tested ticks. Stratford showed 24% on 37 and Easton 23% on 26. Sherman’s 9 tested ticks had none. With so few ticks, one positive more or less moves the share by several points.
Where was the Lyme-positive share highest?
Among the 14 towns where CAES tested at least 50 ticks, Newtown had the highest share positive for the Lyme bacterium: 47% (68 of 146) in 2025. Norwalk had the lowest of those 14, 31% (29 of 93). The highest shares overall come from small samples: Sherman 67% (6 of 9), Weston 57% (8 of 14) and Easton 54% (14 of 26). Darien had the lowest of all 23 towns, 22%, on 37 tested ticks. Statewide, 36.9% of tested blacklegged ticks carried the bacterium.
Did the Lyme-positive share rise from 2024 to 2025?
Yes, in every town with enough ticks to compare. In all 11 towns where CAES tested at least 50 ticks in both years, the share of tested ticks positive for the Lyme bacterium rose, comparing the 2024 summary with the 2025 summary. Redding rose most, from 23% to 43% (117 and 153 tested ticks), then Stamford, from 14% to 32% (117 and 188), and Newtown and Norwalk, 16 points each: 31% to 47% in Newtown and 15% to 31% in Norwalk. In between came Trumbull (21% to 35%), Fairfield (25% to 36%), Westport (24% to 33%) and Ridgefield (36% to 43%). The smallest rises were in Monroe (38% to 42%), New Canaan (29% to 33%) and Wilton (33% to 36%). Statewide the share went from 27.4% of 3,303 tested ticks in 2024 to 36.9% of 3,975 in 2025.
Across all 23 towns, the share rose in 19, fell in 3 and held in 1, and every fall came on a small sample. Shelton went from 39% to 23% (18 and 31 tested ticks), Darien from 29% to 22% (28 and 37) and Bridgeport from 40% to 38% (5 and 8). Greenwich stayed at 25%, on 4 tested ticks each year; the count is low because the town tests ticks in its own lab. The biggest jumps also rest on few ticks: Easton went from 18% to 54% (22 and 26) and Sherman from 38% to 67% (8 and 9).
A rising share among submitted ticks is a warning sign, not a measure of human illness. People send in the ticks that bit them, and only blacklegged ticks that fed on a person are tested.
Where did West Nile virus turn up in 2026?
By October 13, 2026, 16 of the 20 towns with a CAES trap had at least one West Nile virus-positive sample, according to the CAES 2026 testing summary. Stamford, Greenwich and Stratford had 14 positive samples each, the most in the county; in Greenwich 12 came from the Civic Center trap, and in Stratford 12 from Beacon Point. Bridgeport had 11, Darien 7, Westport 6, and Bethel and Fairfield 5 each. The traps in Easton, Monroe, Ridgefield and Wilton were all negative. Brookfield, New Fairfield and Sherman have no CAES trap on the 2020-2026 trap list, so their cells say none reported rather than zero.
These are positive samples, meaning tested batches of mosquitoes at a trap site, not counts of mosquitoes or of sick people. Statewide, CAES had found infected mosquitoes in 48 towns by mid-October, and the state counted two human West Nile cases in Fairfield County, according to the state mosquito program page. CAES’s trapping brochure says the greatest risk of human infection runs from July to September.
Why is housing age in a tick table?
Because the town pages use it for other pests. Bridgeport’s median home dates from 1955, the oldest of the 23 towns, followed by Darien at 1956 and Stratford at 1958. Brookfield and Monroe have the newest, 1978, by the Census Bureau’s year-built table. The town pages use it as background for mice, termites and carpenter ants, but none of the sources here measures pests by house age, so read the column as context, not as risk.
How was this table compiled?
Each figure was copied from the CAES and Census sources linked in its row, and each row of the CSV lists them. The rules:
- Ticks submitted to CAES, 2025 (
ticks_submitted_2025in the CSV) is the number of ticks CAES identified from the town in 2025, from its passive surveillance summary. It counts ticks people sent in, so it depends on how many residents use CAES, which is why Greenwich’s own lab makes its count low. Where a town is served by a health district, CAES counts the district’s submissions in the row of the town where the district is based: Westport’s figure includes district submissions, and so can Newtown’s, while Weston’s and Shelton’s rows hold only individual submissions. No tick is counted twice. - Ticks tested, 2025 (
ticks_tested_2025in the CSV) is how many of those ticks CAES tested. It tests only engorged blacklegged ticks, which fed on a person, so this is usually lower than the number submitted. - Lyme-positive share, 2025 (
lyme_positive_pct_2025in the CSV) and Babesia-positive share, 2025 (babesia_positive_pct_2025in the CSV) are the shares of the town’s tested ticks positive for Borrelia burgdorferi and Babesia microti, as CAES rounds them. The notes flag the towns where few ticks were tested. - Ticks tested, 2024, Lyme-positive share, 2024 and Babesia-positive share, 2024 (
ticks_tested_2024,lyme_positive_pct_2024andbabesia_positive_pct_2024in the CSV) come from the same town table in the CAES 2024 summary, under the same health-district rule: Weston (Westport district) and Shelton (Seymour district) count individual submissions only. - Small sample, 2025 (
small_sample_2025in the CSV,trueorfalse) marks the towns where CAES tested fewer than 50 ticks in 2025, the threshold this page uses for its rankings and its year-to-year comparison. - WNV-positive mosquito samples, 2026 (
wnv_positive_samples_2026in the CSV) adds up West Nile virus-positive samples at the town’s CAES traps through October 13, 2026. Samples positive only for other viruses are not counted. It is a season still in progress when this was compiled. - CAES mosquito trap (
wnv_trap_presentin the CSV,trueorfalse) is false for Brookfield, New Fairfield and Sherman, which have no CAES trap. Only those three rows leave the WNV count empty, so the count column holds only whole numbers, and a 0 always means a trap whose samples were all negative. - Median year built (
median_year_builtin the CSV) is from the American Community Survey 5-year estimates, 2020-2024. - Human cases are not in the table. CDC’s Lyme public-use data reports Connecticut by planning region from 2023, not by town. In 2023 the Western Connecticut planning region, which includes 16 of the county’s 23 towns, had 534 cases. The Greater Bridgeport planning region, which includes Bridgeport, Easton, Fairfield, Monroe, Stratford and Trumbull, had 184. Shelton is in the Naugatuck Valley planning region.
CAES may revise its summaries, and the 2026 mosquito season was still being counted. Check the linked reports before relying on a figure. The about page explains how this guide is researched and where to send corrections.
Sources
- CAES, Summary of Tick Testing Results, 2025: https://portal.ct.gov/caes/-/media/caes/documents/tick_testing/summary-of-tick-testing-results-2025-readable-20.pdf
- CAES, Summary of Tick Testing Results, 2024: https://portal.ct.gov/caes/-/media/caes/documents/tick_testing/summary-of-tick-testing-results-2024-readable-20.pdf
- CAES, 2026 mosquito testing summary (as of October 13, 2026): https://portal.ct.gov/caes/-/media/caes/documents/mosquito-testing/october-2026/2026-testing-summary-as-of-october-13.pdf
- CAES, Mosquito trapping locations, 2020-2026: https://portal.ct.gov/caes/-/media/caes/documents/mosquito-testing/trapping-stations-tables/mosquito-trapping-locations-2020-2026.pdf
- US Census Bureau, ACS 2020-2024 median year structure built (B25035): https://data.census.gov/api/access/data/table?id=ACSDT5Y2024.B25035&g=040XX00US09$0600000
- Town of Fairfield, information on tick-borne diseases: https://fairfieldct.gov/service/health_department/information_on_tick_borne_diseases.php
- Town of Greenwich, Environmental Services fees: https://www.greenwichct.gov/625/Environmental-Services-Fees
- CAES, Tick Management Handbook (Bulletin 1010): https://portal.ct.gov/-/media/caes/documents/publications/bulletins/b1010pdf
- CAES, press release on tick activity (April 6, 2026): https://portal.ct.gov/-/media/caes/press-room/caes-press-release-tick-activity-4-6-26.pdf
- Connecticut General Statutes, chapter 441: https://www.cga.ct.gov/current/pub/chap_441.htm
- State of Connecticut mosquito trapping and arbovirus testing program: https://portal.ct.gov/caes/mosquito-testing/introductory/state-of-connecticut-mosquito-trapping-and-arbovirus-testing-program
- CAES, mosquito trapping and testing brochure (July 2025): https://portal.ct.gov/caes/-/media/caes/documents/mosquito-testing/caes-mosquito-trapping-brochure-july-2025.pdf
- CDC, Lyme disease public-use aggregated data: https://data.cdc.gov/National-Center-for-Emerging-and-Zoonotic-Infectio/Lyme-disease-public-use-aggregated-data-with-geogr/x5j9-wybp
- CAES, Information on Submitting Ticks: https://portal.ct.gov/caes/tick-office/tick-office/information-on-submitting-ticks
- CDC, Where Ticks Live (updated July 30, 2025): https://www.cdc.gov/ticks/about/where-ticks-live.html
- University of Florida IFAS Extension, Brown Dog Tick, EENY-221 (Cynthia C. Lord, July 2001, archived): https://journals.flvc.org/edis/article/view/110458
- CDC, Preventing Tick Bites (August 28, 2024): https://www.cdc.gov/ticks/prevention/index.html
- CDC, Lyme Disease Signs and Symptoms (May 15, 2024): https://www.cdc.gov/lyme/signs-symptoms/index.html
- CDC, What to Do After a Tick Bite (June 9, 2026): https://www.cdc.gov/ticks/after-a-tick-bite/index.html
- CDC, Causes of Lyme Disease (updated September 24, 2024): https://www.cdc.gov/lyme/causes/index.html
- CAES and DEEP, press release on lone star ticks (2017): https://portal.ct.gov/-/media/caes/documents/publications/press_releases/2017/caesdeeppressreleaselonestartickspdf.pdf
- CAES, press release on the Asian longhorned tick (September 2020, posted by the Town of Newtown): https://www.newtown-ct.gov/sites/g/files/vyhlif12216/f/uploads/caes_press_release_asian_long_horned_tick_9.24.2020.pdf
- Town of Trumbull, Ticks: https://www.trumbull-ct.gov/180/Ticks
- Naugatuck Valley Health District, Environmental Health: https://www.nvhd.org/environmental-health/
Use this data
Free to reuse under CC BY 4.0, with a link back to this page. The figures come from the sources listed above.
How to cite: Fairfield County Pest Guide, 'Tick season in Fairfield County, CT: tick and mosquito data by town', https://fairfieldcountypest.com/guides/tick-season-fairfield-county/, updated October 20, 2026.
Changelog: Updated : first public version
Changelog: Updated : expanded from 8 to all 23 towns of the county, sorted alphabetically; added the ticks tested and the Babesia-positive share; added a chart of ticks submitted by town
Changelog: Updated : added 2024 ticks tested and Lyme- and Babesia-positive shares for all 23 towns from the CAES 2024 summary; added the small_sample_2025 and wnv_trap_present columns
Using this data? Contact [email protected].
Frequently asked questions
What's the worst month for ticks?
May, June and July, when blacklegged tick nymphs peak, according to the CAES Tick Management Handbook. Adults are active in October and November and again in early spring, and because they do not hibernate they can bite on warm winter days.
When should I start spraying for ticks?
The CAES handbook advises one application in May or early June, aimed at the nymphs. An October application may be used against adult ticks, or a spring one if there was no fall spray. In Connecticut, anyone spraying for hire must be a certified applicator working for a DEEP-registered business.
Is 2026 the worst tick season?
The CAES release this guide relies on does not call it the worst. CAES did warn in April 2026 that tick submissions were rising, about 30 a day, and that more than 40% of those ticks tested positive for the Lyme bacterium. That was at the start of adult tick season, when infection rates are often higher.
Which towns sent CAES the most ticks in 2025?
Westport sent 277, the most of the county's 23 towns, a count that includes ticks from its health district. Ridgefield sent 217, Stamford 211 and Wilton 207. Greenwich shows only 6 because the town tests ticks in its own laboratory, for a $76 fee, so its count measures submissions, not how many ticks are out there.
Which Fairfield County town has the highest Babesia rate in ticks?
Danbury. In 2025, 28% of the ticks CAES tested from the city (15 of 53) carried Babesia microti, the parasite that causes babesiosis. Among the 14 towns with at least 50 tested ticks, Redding came next at 22%. Statewide it was 14.8%. Bridgeport and Greenwich showed 25%, but on only 8 and 4 tested ticks.
What kind of ticks are in Connecticut?
Mostly blacklegged (deer) ticks: they were 69.4% of the 5,896 ticks sent to CAES in 2025. American dog ticks made up 25.2%, lone star ticks 4.5% and Asian longhorned ticks 0.8%. Of the four, only the deer tick spreads the Lyme disease bacterium; CDC says lone star and American dog ticks cannot transmit it.
Can I download and reuse the data?
Yes. The table is a free CSV file under a CC BY 4.0 license: reuse it with a link back to this page. Each row lists the CAES and Census sources its figures come from, and the changelog under the download link records any update.